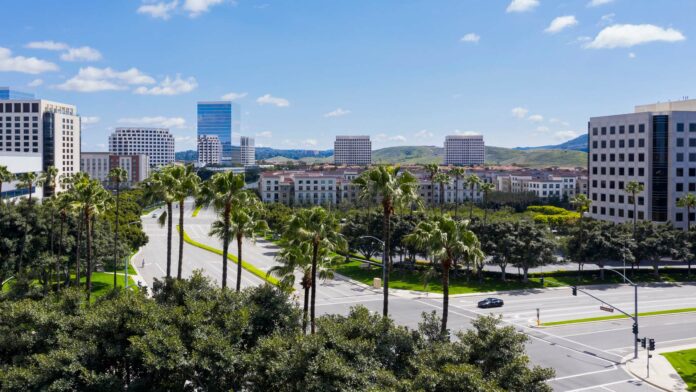
Though outer suburbs grew fastest during the 2010’s, many downtowns and central districts also grew quickly.
The 2020 US Census Revealed US Population Density Rebounded During Last Decade
Unlike the 2000’s and 1990’s when population density actually declined, density actually grew during the decade of the 2010’s, according to the 2020 US Census.
The fastest growth-neighborhoods were suburbs on the edges of metro areas. Think exurban areas such as Raleigh NC and Houston TX.
READ: 2022 Top Agent Success Secrets [Revealed]: New FREE Real Estate Coaching Web Event, Revealing 17 Surprising Secrets Of The Top 100 $ Millionaire Agents. Get Your FREE Spot For The 2022 Real Estate Coaching Webinar Now. After You Have Attended This Event You Will Have A Huge Feeling Of Relief Knowing You Will FINALLY Laugh At Your Money Worries – You Will Have Your Own Personalized 2022 Step-By-Step Business Plan. Learn Now How To Generate 100’s of Motivated Leads for FREE, Without Coming Off As A Pushy Salesperson and Losing Your Soul. You Will Soon Know How To Become One of the 1000s of Agents Making HUGE Money Who Never Thought They Could. YES, I Want To Attend The FREE Webinar! <——Click To Register
P.S. Free Webinar, Limited Space. Less Than 300 Spots Still Available.
15 Densest Metro Areas in US
By the time 2020 rolled around, according to the US Census, more Americans were more likely to live in the country’s highest-density neighborhoods than in 1990, 2000 or 2010. Take a look:
- New York
- Honolulu
- San Francisco
- Chicago
- Los Angeles
- Boston
- Washington
- Miami
- Philadelphia
- Seattle
- San Jose
- San Diego
- Las Vegas
- Denver
- Portland OR
Large metros with the lowest density include Birmingham, AL, Nashville, TN, and Charlotte NC. Among the metros with 5M or more people, Atlanta has the least density.
Spread of Population Across Country’s Landmass is Uneven
Since much of the country’s land is essentially unpopulated, half of all households live in census tracts with at least 900 households per square mile. The average neighborhood density is now over 2,450 households per square mile.
(A census tract has approximately 1,5000 households.)
During the 2010’s, density grew unevenly. Some density increased due to development in and near big-city downtowns such as Seattle and Atlanta. In other metros such as Austin, San Antonio and Oklahoma City, density spread out or sprawled into respective exurbs and on the outer edges of their regions.
Another factor influencing density patterns during the 2010’s was downtown development prices. Those prices essentially excluded many except Caucasian, college-educated, young adults with no school-aged children.
Looking Ahead
Could the outmigration patterns of the 2020 pandemic that stimulated movement away from the country’s most densely packed neighborhoods in cities such as New York and San Francisco stick through the 2020’s? We don’t know yet.
All we do know at this point in time is that there was more outmigration from central neighborhoods in the nation’s largest metros during 2020 than in 2019.
Another thing we now know during Q2 and the first half of Q3 2021 is that central neighborhoods in the nation’s largest metros are beginning to “fill up.” Occupancy rates are rising, rent concessions are nearly past tense, and rent prices are (or have been) rising above pre-pandemic levels as tenants flock back into major urban center neighborhoods.
Thanks to the US Census Bureau and The New York Times.


