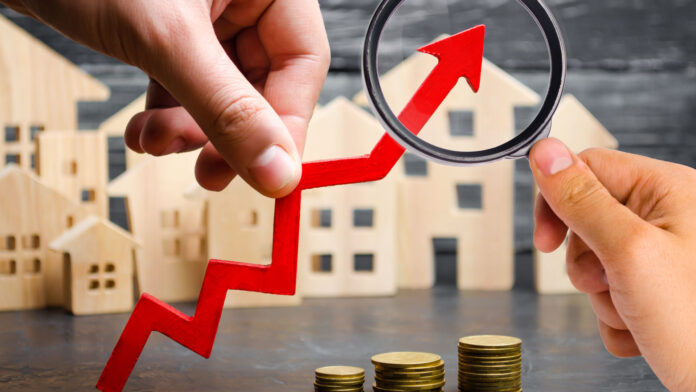
How much longer can this go on? When will the saga of low inventory leading to higher prices in homes end? That’s a great question! Unfortunately, it doesn’t seem to have a concrete answer in site. This week, Bloomberg reported that homes prices in 20 U.S. continued to increase, while national property values had their largest rise since the middle of 2014.
Coupled with rising interest rates and an uncertainty about the incoming President and his policies, is this the only forecast for the forseeable future? Bloomberg talks to Yale Professor Robert Shiller to get his take on things, but even Shiller seems to be at a loss to make an actual ‘prediction.’
Shiller says its too soon to tell whether or not the status quo will hold on or 2017 will usher in a ‘Trump Boom.’ In this clip from BloombergTV, Shiller says, “”The numbers we’re reporting today are from October, before the Trump election. Everything looks different now. I don’t know where we’re going. The numbers that we’re showing today don’t look much different from recent months, but existing home sales are high, new home sales are high. There might be a Trump boom coming.”
What would Shiller need to see to make a concrete prediction? Shiller says he would need to see the policies of the Trump administration and how successful Trump is in getting them through.
The bottom line is affordability: How long can the American public participate in a housing market with rising prices and rising interest rates? David Blitzer, chairman of the S&P index committee is quoted as saying “Affordability measures based on median incomes, home prices and mortgage rates show declines of 20-30 percent since home prices bottomed in 2012. With the current high consumer confidence numbers and low unemployment rate, affordability trends do not suggest an immediate reversal in home price trends. Nevertheless, home prices cannot rise faster than incomes and inflation indefinitely.”
Where are the largest jumps in home prices? While all 20 cities in the index showed a year over year gain, at the top of the list was Seattle with a 10.7 percent increase and Portland, Oregon with a 10.3 percent increase. On the flip side, New York had the smallest 12 month increase at 1.7 percent. Interesting to note is that after seasonal adjustments, Atlanta came in with the biggest month over month growth at 1.4 percent with Cleveland trailing at 1.3 percent.


