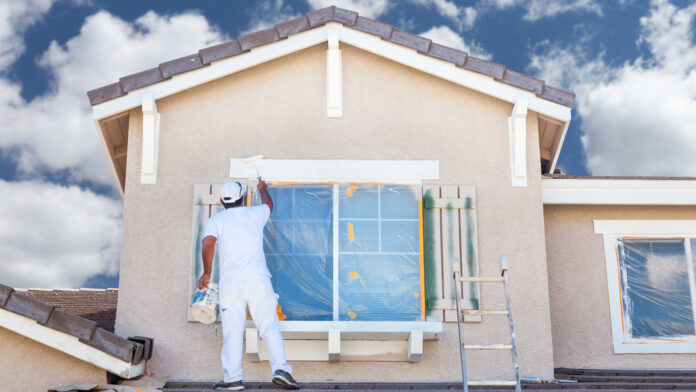
Home flipping rebounded in Q2 2021 while profit margins continued to drop.
Home Flips Represented One in 20 Transaction in Q2 2021
For the first time in more than one year, home flipping activity increased during Q2 2021. The ATTOM Data Solutions Q2 2021 US Home Flipping Report indicated that home flipping activity increased from 3.5% of all sales (one in every 29 home sales) in Q1 2021 to 4.9% of all home sales (one in every 20 home sales) during Q2 2021.
Though this increase was welcomed by home flipping investors, this increase remained below the home flipping activity in Q2 2020 that hit 6.8% of all home sales, or one in 15 sales.
READ: 2022 Top Agent Success Secrets [Revealed]: New FREE Real Estate Coaching Web Event, Revealing 17 Surprising Secrets Of The Top 100 $ Millionaire Agents. Get Your FREE Spot For The 2022 Real Estate Coaching Webinar Now. After You Have Attended This Event You Will Have A Huge Feeling Of Relief Knowing You Will FINALLY Laugh At Your Money Worries – You Will Have Your Own Personalized 2022 Step-By-Step Business Plan. Learn Now How To Generate 100’s of Motivated Leads for FREE, Without Coming Off As A Pushy Salesperson and Losing Your Soul. You Will Soon Know How To Become One of the 1000s of Agents Making HUGE Money Who Never Thought They Could. YES, I Want To Attend The FREE Webinar! <——Click To Register
P.S. Free Webinar, Limited Space. Less Than 300 Spots Still Available.
Home Flipping Profit Margins Dipped to 10-Year Low
Home flipping activity increased comparatively in Q2 2021 to Q1 2021 as did the gross profit on a typical home flip nationwide. The gross profit in Q2 2021 rose to $67.000, up +2.4% from $65,400 in Q1 2021 and +3.1% from $65,000 in Q2 2020.
The problem, however, is that the gross-flipping profit of $67,000 during Q2 2021 translated into just a 33.5% return on investment, down from 37.2% ROI in Q1 2021. The gross-flipping profit in Q2 2021 was down from 40.6% in Q2 2020…the lowest since Q1 2011.
Profit Margins Dropped in Nearly Two-Thirds of Markets
This decrease of -7.1% in typical profit margins marked the largest annual drop in flipping profit margins since mid-2014. Why? Soaring home prices. Those soaring home prices did not jump the gap between prices more on the purchase side than on the resale side for flippers.
On the plus side, home flippers took an average of 147 days to complete their sales transactions. This is the lowest level since Q2 2010 and also down from an average of 156 days in Q1 2021.
Highest Home Flip Raw Profits Concentrated in West, Northeast and South
According to ATTOM Data Solutions, the median price of homes flipped in Q2 2021 hit an all-time high of $267,000, an increase of +10.6% from $241,400 in Q1 2021 and +18.7% from $225,000 in Q2 2020. This was the biggest price jump for flipped homes since 2005.
The metros with the top grow profits included:
- San Jose – $242,500
- Fargo ND – $200,336
- San Francisco – $182,000
- Salisbury MD – $159,500
- Barnstable MA – $155.500
Thanks to ATTOM Data Solutions.


