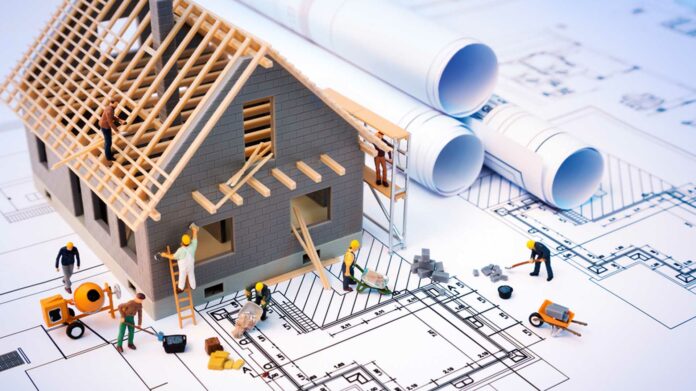
Costs of construction essentials, such as labor and materials, across all building types (residential, commercial and agricultural) remained inflated during Q2 22 throughout the US and Canada.
Highlights of Construction Costs in Q2 22
- Residential reconstruction costs increased +12% y/y in the US and over +6% y/y in Canada.
- Most of these cost hikes occurred between Q2 21 – Q3 21.
- Building permits in the US increased +7% y/y in March 2022.
- Building permits for 5+ housing units increased +36% y/y.
Quiz:
Please choose one answer:
1) I am ready to join EXP Realty.
2) I am interested in EXP Realty and need more info.
3) I am not interested in EXP Realty.
Key:
* If you answered “#1” congratulations. You are about to join the fastest-growing real estate company in the world. Tim and Julie Harris are inviting you to join them at EXP Realty. Text Tim directly for the next steps: 512-758-0206. (text only please)
* If you answered “#2” please watch the videos and check out the other intel on this site. http://whylibertas.com/harris .
* If you answered ‘#3’ no worries. You will want to check out whylibertas.com/harris so you can at least know what EXP Realty is and why so many agents are moving to EXP.
Economic Indicators
With significant disruptions to the US economy over the course of the pandemic, home prices have skyrocketed. Prices of existing homes have soared +18% and prices of new home stock have increased +19%.
Take a look at some key economic indicators by quarterly comparisons.
(All data presented here has been sourced from the US Bureau of the Census, National Association of Realtors, US Bureau of Labor Statistics, The Conference Board, Freddie Mac and CoreLogic.)
Q4 21 Q1 22
Housing Starts 1,870 1,753
Building Permits 1,752 1,878
Home Sales 6,967 6,878
New 764 814
Existing 6,203 6,083
Consumer Confidence 112.9 108.1
30-Year Fixed Mortgage Rate 3.1% 3.8%
Q1 21 Q1 22
Home Price Y/Y Change
New 2.4% 18.1%
Existing 11.1% 20.9%
Changes in Individual Material Costs Since Beginning of Pandemic
Costs for many individual building materials have continued to surge in both the US and Canada since the onslaught of the COVID pandemic. Strong demand and supply shortages for those materials have kept costs high to this day. For example, PVS has seen a significant cost increase of between 100% – 200% across the US and Canada because of its petroleum base used in manufacturing.
Take a look at some of essential material cost comparisons from March 2020 to March 2022, according to CoreLogic:
Material US Canada
Copper Wire +160% +130%
Plywood +116% +86%
Lumber +106% +100%
Copper Pipe +83% +52%
Steel Stud +74% +51%
Asphalt Shingles +14% +12%
Comparison of Labor Costs in US & Canada
Skilled labor costs in the US have soared significantly from March 2020 to March 2022. Labor cost growth in Canada has and remains relatively more stable. Check out just a few of job categories to compare labor cost growth in the US and Canada from data provided by CoreLogic:
Job Category US Canada
Teamster +14% +5.75%
Operating Engineer +10.5% +4%
Roofer +9% +4%
Tile Setter +9% +5%
Painter +8.1% +3.9%
Electrician +8% +4.2%
Laborer +8% +3.75%
Plumber +7.8% +5.2%
Carpenter +7% +4%
Construction Job Growth in US
US employment in construction totaled 7,628,000 in March 2022.
Employment in 3/2022 Most Growth Largest Decline
Total – 7,628,000 Idaho – +13% PA- -7%
+68,000 q/q Montana – +12% New York – -7%
+220,000 y/y Utah – +12% N. Dakota – -6%
Thanks to CoreLogic.
URGENT! Exclusive Invite: Join Premier Coaching for FREE! You read that correctly, Premier Coaching for the first 30 days is 100%, no strings attached FREE. Here is what you get: DISC Personality Test, Seller and Buyer Scripts, Presentations, Lead Generation Systems, Market Shift Plan, Real Estate Treasure Map, Members Only Community Groups (and a ton more). The best part is you will have a DAILY Live Coaching Call with a Harris Certified Coach. Yep, you read that correctly….every weekday you will attend a semi-private coaching session with your coach. All of this is 100% FREE. Of course, you want to join Premier Coaching. There is Zero Risk and joining costs you nothing. This is the Real Estate Success system you need in this quickly changing market. Join Premier Coaching NOW.


