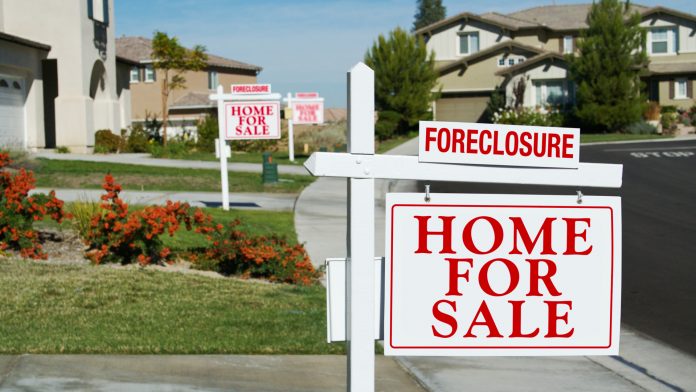
ATTOM Data Solutions’ latest Q3 2019 US Foreclosure Market Report indicates that foreclosure activity across the country dropped to its lowest level since 2005.
Overall, according to ATTOM, foreclosures dropped -8% from Q2 2019 and -15% from Q3 2018.
BUT, 14 states and 66 of the 220 metros analyzed for this report countered this trend. The states posting the most increased foreclosure activity during Q3 2019 included…
- Montana – +33%
- Georgia – +32%
- Washington – +16%
- Louisiana – +15%
- Michigan – +12%
The metros posting the most increased activity during Q3 2019 included…
- Atlanta – +37%
- Columbus OH – +27%
- San Antonio – +24%
- Portland OR – +22%
- Tucson – +21%
Nationwide, 1 in 946 properties had foreclosure filings in Q3 2019. States with the highest rates of foreclosure filings included…
- Delaware – 1 in 415 properties (an increase of +425% from last year!!!)
- New Jersey – 1 in 436 properties
- Maryland – 1 in 500 properties
- Illinois – 1 in 517 properties
- Florida – 1 in 577 properties
Metros with the highest rates of foreclosure filings included…
- Atlantic City NJ – 1 in 269 properties
- Trenton NJ – 1 in 312 properties
- Rockford IL – 1 in 366 properties
- Fayetteville NC – 1 in 369 properties
- Peoria IL – 1 in 388 properties
During September 2019, what ATTOM knows thus far is that nationwide, 1 in 2,767 properties had foreclosure filings. Some 24,453 properties began the foreclosure process…this represents a decrease of -12% from August 2019 and a decrease of -15% from one year ago.
States with the highest foreclosure rates in September 2019 included…
- Delaware – 1 in 1,170 properties
- Maryland – 1 in 1,270 properties
- Illinois – 1 in 1,409 properties
- New Jersey – 1 in 1,534 properties
- Connecticut – 1 in 1,997 properties.
Prior to ATTOM’s just released Q3 2019 Market Foreclosure Report (that was mirrored by CoreLogic’s latest foreclosure data), Andrew De Pietro of msn.com looked into the percentage of homes in negative equity in the country’s largest metros. (Negative equity and foreclosure activity are tow key indicators of downturns in both sales volume and prices.)
De Pietro determined that 40 metros were on the cusp of a housing crisis due to the number of homes per each metro in negative equity. Here are the top 10 (or worst, depending upon your perspective) metros that could be in trouble based specifically on the share of homes in negative equity.
- Newark NJ – 27.9% in negative equity
- Detroit – 34% (the highest underwater rate among the 40)
- Bridgeport CT – 26.9%
- Baltimore – 26.5%
- Hartford CT – 22.4%
- Paterson NJ – 24.7%
- Cleveland – 25.9%
- Fayetteville NC – 26.8%
- Dayton OH – 27.6%
- Montgomery AL – 28.2%
Thanks to ATTOM Data Solutions and msn.com’s Andrew De Pietro for source data.
Also read: St. Louis is #1 Flipping Market in Q2 2019, Lending to House Flippers Now at 13-Year High, Top 10 Counties with Best & Worst Home Affordability


