Key Highlights
- CoreLogic Home Price Index indicated home price growth doubled since one month before onset of pandemic
- Some buyers newly willing and able to pay premium prices
Share of Sales At/Above List Prices Reaches New Highs
Once the COVID-19 pandemic gripped the US in February/March 2020, home price growth has doubled, according to CoreLogic’sHome Price Index.
Historically low mortgage rates have enabled willing homebuyers to actually pay premium prices to “get” the homes they wanted since the pandemic upended the housing market.
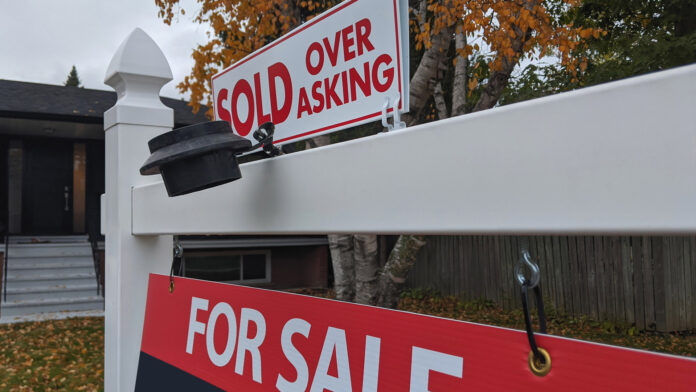
Beginning in July 2020, the share of homes sold at or above list price reached and then exceeded the previous peak in June 2004 of homes selling at or above list. By the time February 2021 rolled around, more than half of homes sold were sold at or above list price.
That share of homes sold at or above list price reached a new high of 51.4% of total sales. This 51.4% represents nearly triple the share of homes sold at or above list in January 2008 at the height of the housing crisis and more than 10% higher than in March 2020.
Cities with Highest Share of Homes Sold at List Price
Since most every aspect of real estate is local (sales and listing patterns), the share of homes sold at or above list price varies among the metro areas CoreLogic analyzes.
Cities with the largest share of homes selling at or above list price included:
- Seattle – 73.8%
- Denver – 71%
- Washington DC – 67.5%
- Los Angeles – 60%
- Phoenix – 59%
Cities with the lowest share of homes selling at or above list price included:
- Miami – 22%
- Chicago – 30%
- Orlando – 32%
- Houston – 36%
- Philadelphia – 40%
Thin Supply Translates into Increased Price Pressure
CoreLogic clearly makes the case that low supply leads directly to higher prices.
The tipping point seems to be that when the total supply of houses drops below a three-month supply, home prices increase. (A six-month market supply has normatively indicated a balanced market…and much fewer at or above list price sales.)
For example, San Jose’s thin supply has resulted in homebuyers there paying an average of +3.8% more than the list price. Miami, on the other hand, has had a relatively high market supply. Those Miami homebuyers have been able to negotiate sale prices an average of -6.6% below the list price.
Thanks to CoreLogic.
URGENT: 2021 Results Released. New FREE On-Line Web Event Reveals 17 Surprising Secrets Of The Top 100 Millionaire Agents. Get Your FREE Spot For The On-Line Webinar Now. When You Attend This Event You Will Have A Sense Of Relief Knowing You Can FINALLY Laugh At Your Money Worries – If You Follow This Simple Plan. Learn How To Generate 100’s of Motivated Leads Without Coming Off As A Pushy Salesperson and Losing Your Soul. Learn Now How To Become One of the 1000s of Agents Making HUGE Money NOW Who Never Thought They Could.
P.S. Limited Space Available. 235 Spots Left.


