Key Highlights
- NAHB Q2 report on building conditions adds more data indicating city to suburban movement
- Small metro area suburbs showing +10.6% uptick
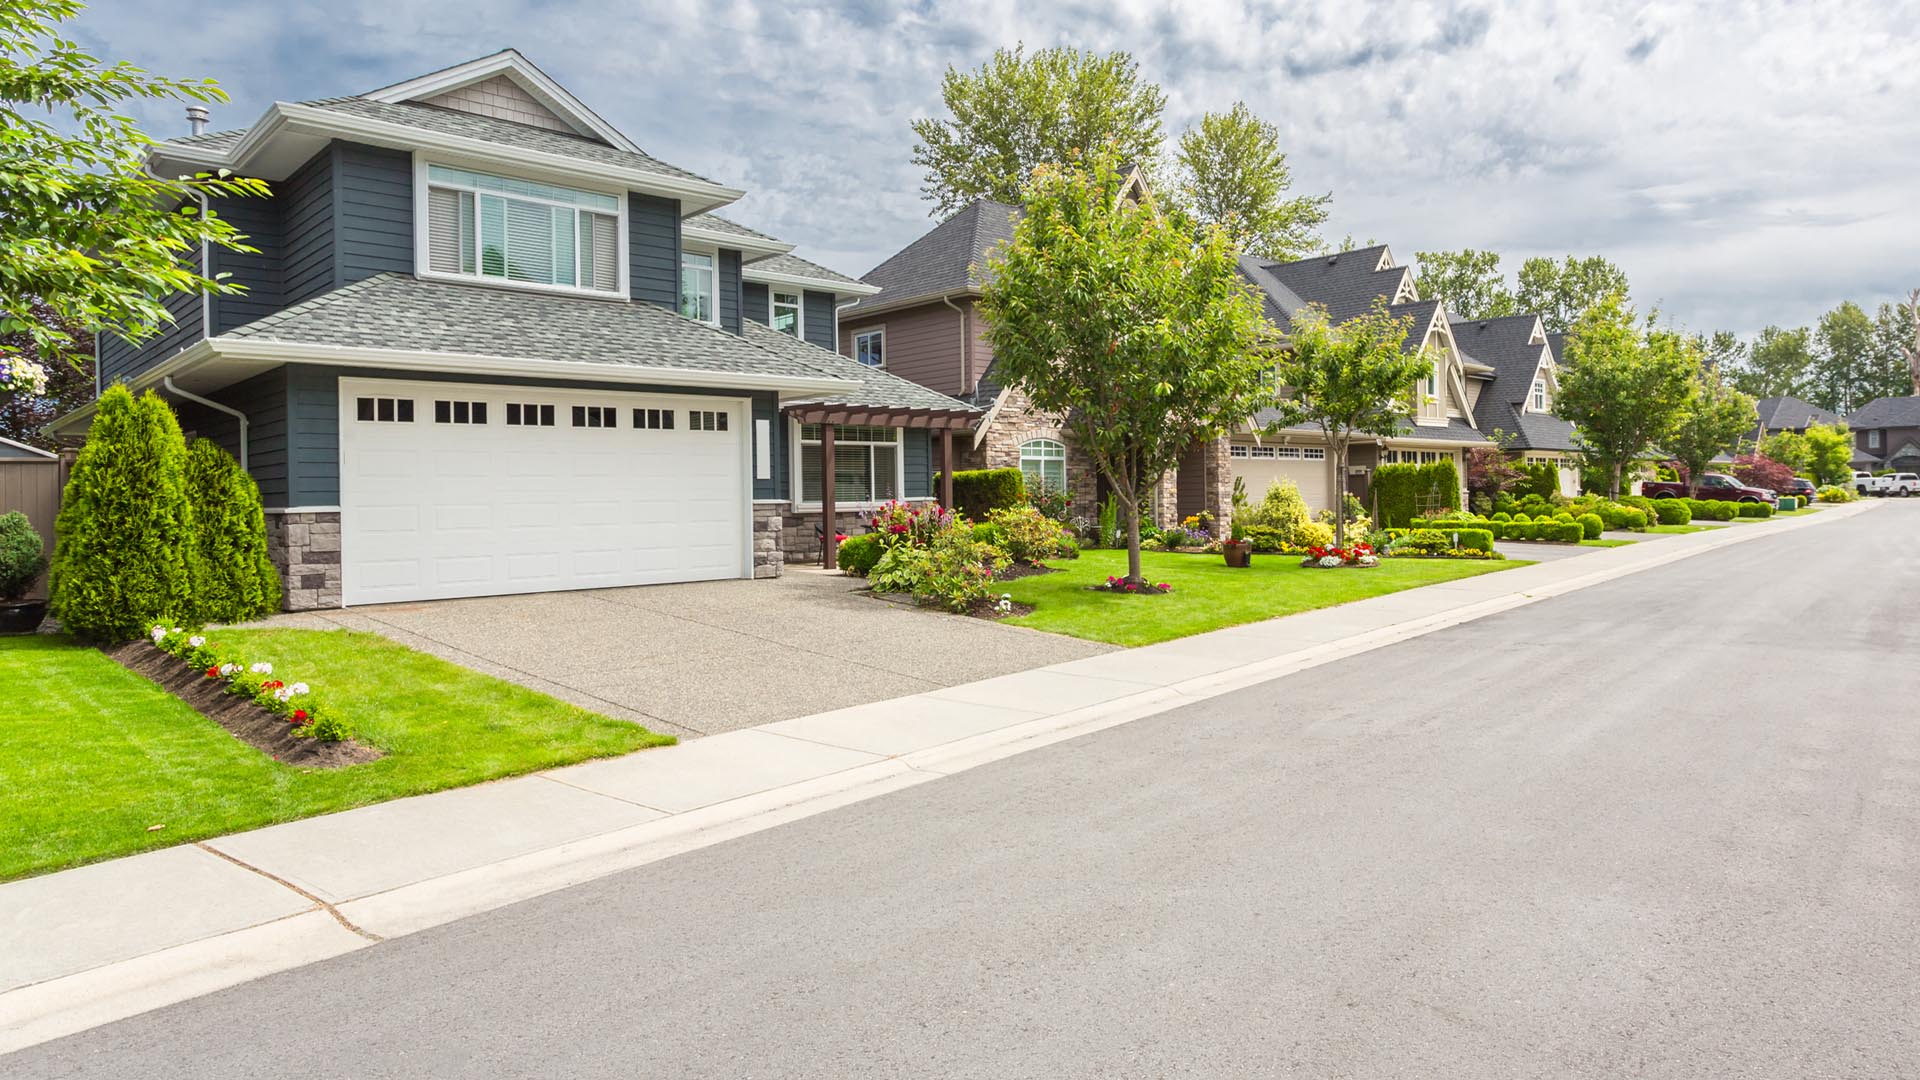
The National Association of Home Builders (NAHB) recently released its Q2 2020 report on building conditions around the country. The most notable data in this report puts meat on the bones to the conventional wisdom that homebuyers are looking to move out of cities.
Download Your FREE Ultimate Agent Survival Guide Now. This is the exact ‘do this now’ info you need. Learn NOW How to Access All The Bailout Program Cash You Deserve. Including Unemployment and Mortgage Forbearance Plans. To Access the Ultimate Agent Survival Guide Now Text The Word SURVIVAL to 47372. 4 Msgs/Month. Reply STOP to cancel, HELP for help. Msg&data rates may apply. Terms & privacy: slkt.io/JWQt
The NAHB focuses on seven regional geographies in its Home Building Geography Index. Here’s the breakdown of geographical areas of most interest to potential homebuyers based upon their survey responses in Q2, according to the NAHB:
- Small metro area suburbs – +10.6%
- Micro county small towns – +9.3%
- Small metro core county – +7.5%
- Large metro suburban county – +4.5%
- Non-metro micro county or rural – +4.3%
- Large metro core county – +3.9%
The NAHB Home Building Geography Index uses county-level information about single and multifamily permits to evaluate demand for housing construction growth. The COVID pandemic has spurred city folks to look to the suburbs and beyond. According to NAHB Chair Chuck Fowke, “The increasing demand for construction in more suburban neighborhoods is being driven in large part by the coronavirus outbreak. The growing trend for working at home is enabling more families to choose to live in lower-cost, lower-density communities.
Market share for single-family construction in low-density areas (small metro core and suburbs, small towns and rural markets) increased +1% point to 48.4% in Q2. Fastest growing geographies for multi-family construction were in exurbs, small metro suburbs and rural areas. This share of the market grew from 32.9% in Q2 2019 to +34.0% in Q2 2020.
The report stated, “…changes in market share are usually slow to develop…this makes a one percentage point y/y gain noteworthy when compared to recent historical data.”
To get the full NAHB Home Building Geography Index across all seven NAHB regional target areas that indicate market share and growth for both single-family and multifamily construction, go to
https://www.nahb.org/News-and-Economics/Housing-Economics/Indices/Home-Building-Geography-Index
Thanks to the National Association of Home Builders and the Motley Fool’s Millionacres.
Also read: Financial Pain from COVID Pandemic “Much, Much, Much” Worse than Expected, US Homebuilding Drops to 5-Year Low in April, Builder Confidence & Mortgage Purchase Application Up


